Tamworth, Staffordshire - Live Weather Station

19°C
Tamworth, England
Language:  English
Updated:  01-Jul-2025 03:50 
  Night time, Dry, Clear Temperature: 18.9°C Colder 1.5°C than last hour.   -1.5°C/hr Humidity: 81%Increased 4.0% since last hour. Dew Point: 15.6°CDecreased 0.7°C since last hour. Wind: NNE  1.6 mph Gust: 2.9 mph Barometer: 1013.5 hPaRising 0.6  hPa/hr  Rising slowly Rain Today: 0.0 mm UV Index: 0.0  None

Navigation

  • Home
  • Alt Dashboard
  • 7 Day Forecast
  • Local/UK Radar
  • Weather Warnings
  • Temperature Map
  • Precipitation Map
  • Wind Map
  • Surface Pressure Charts
  • Clouds/Satellite
  • Lightning Map
  • UV Index
  • GFS Run/GEFS Ensembles
  • Jet Stream
  • Snow Risk
  • Sunshine Hours
  • Sea Temperatures
  • Temp/Rain Averages
  • Frosts/Freeze Data
  • Station Trends
  • Station Graphs
  • Local Climate Data
  • Station History
    • Daily History
    • Monthly History
    • Seasonal History
  • Station Records
    • Daily Records
    • Current Month Records
    • Current Year Records
    • All Time Records Since 2001
  • World Extremes
  • Global Climate Temperatures
  • Sun/Moon Almanac
  • Aurora Forecast
  • Astrophotos
    • Deep Sky Objects
    • Widefield
    • Moon/Stars
    • Northern Lights
  • Earthquakes
    • Earthquakes UK
    • Earthquakes World
  • About Us
  • Station System Status

Mobile Weather

Get TamworthWx SmartPhone Weather QRCode2Scan With Phone's Bar Code Reader


UK Extremes


Past 24 hours
 
High Temp
St James Park
31.0 C
 
Low Temp
Eskdalemuir
5.6 C
 
Precipitation
Preston Moor Park
6.2 mm
 
Sunniest
Boulmer
15.1 hours

© Crown Copyright 2025 Met Office

Cloudbase


Sunlight


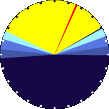
16 h 45 m 12 s
of Sunlight Today

Which is
1 m 6
sec shorter.
than yesterday

16 h 44 m 1 s
of Sunlight Tomorrow
(Noon)
graph
(Midnight)

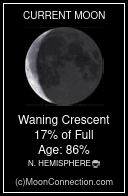
Moon Phase

 moon cycles

Links

Weather Underground PWS ITAMWORT22

Temperature & Rainfall Trends


Note: Trends are based on Average Reading From Official Met Office CET Avg & Rainfall Avg and current data from Tamworth Weather Station location.

Annual Temperature Trend
Month Average since 2001 Current Month Difference
January 4.5°C 3.1°C (2025) -1.4°C1.4°C Colder than All-Time Average Temperature.
February 4.9°C 5.0°C (2025) 0.1°C0.1°C Warmer than All-Time Average Temperature.
March 6.7°C 7.7°C (2025) 1.0°C1°C Warmer than All-Time Average Temperature.
April 9°C 10.6°C (2025) 1.6°C1.6°C Warmer than All-Time Average Temperature.
May 11.9°C 13.5°C (2025) 1.6°C1.6°C Warmer than All-Time Average Temperature.
June 14.8°C 17.7°C (2025) 2.9°C2.9°C Warmer than All-Time Average Temperature.
July 17°C 21.7°C (2025) 4.7°C4.7°C Warmer than All-Time Average Temperature.
August 16.8°C 17.0°C (2024) 0.2°C0.2°C Warmer than All-Time Average Temperature.
September 14.3°C 13.5°C (2024) -0.8°C0.8°C Colder than All-Time Average Temperature.
October 10.8°C 11.1°C (2024) 0.3°C0.3°C Warmer than All-Time Average Temperature.
November 7.2°C 7.2°C (2024) 0.0°C 
December 4.8°C 6.9°C (2024) 2.1°C2.1°C Warmer than All-Time Average Temperature.
Average 12 Month Temperature since 2001: 10.3°C
Current 12 Month Temperature: 10.8°C
Current 12 Month Temperature Trend: 0.5°C0.5°C Warmer than All-Time Average Temperature.

Annual Rainfall Trend
Month Average since 2001 Current Month Difference
January 63.6 mm 89.4 mm (2025) 25.8 mm25.8 mm more than All-Time Average Rainfall.
February 46.9 mm 39.2 mm (2025) -7.7 mm7.7 mm less than All-Time Average Rainfall.
March 46.6 mm 10.5 mm (2025) -36.1 mm36.1 mm Colder than All-Time Average Temperature.
April 48.1 mm 17.0 mm (2025) -31.1 mm31.1 mm less than All-Time Average Rainfall.
May 53.8 mm 27.7 mm (2025) -26.1 mm26.1 mm less than All-Time Average Rainfall.
June 64.9 mm 26.9 mm (2025) -38.0 mm38 mm less than All-Time Average Rainfall.
July 52.9 mm 0.0 mm (2025) -52.9 mm52.9 mm less than All-Time Average Rainfall.
August 66.2 mm 35.3 mm (2024) -30.9 mm30.9 mm less than All-Time Average Rainfall.
September 58.1 mm 151.6 mm (2024) 93.5 mm93.5 mm more than All-Time Average Rainfall.
October 72.8 mm 70.9 mm (2024) -1.9 mm1.9 mm less than All-Time Average Rainfall.
November 69.6 mm 52.8 mm (2024) -16.8 mm16.8 mm less than All-Time Average Rainfall.
December 64.7 mm 51.3 mm (2024) -13.4 mm13.4 mm less than All-Time Average Rainfall.
Average 12 Month Rainfall since 2001: 708.2 mm
Rainfall for last 12 months: 635.2 mm
Current 12 Month Rainfall difference: -73.0 mm73 mm less than All-Time Average Rainfall.
This data is reflective of 12 month trending at the Tamworth Weather Station location. This is not official scientific data. The weather data presented here is based on data collected since 2001. Script courtesy of  Michael Holden from Relay Weather. Script calculations courtesy of Murry Conarroe of Wildwood Weather.
Top | Contact Us
© 2025, Tamworth Weather Station | Weather-Display (10.37S-(b152)) | Valid XHTML 1.0 | Valid CSS

Never base important decisions on this or any weather information obtained from the Internet.